Market Structure Analysis, Reduced Drawdowns
With Bitcoin at new all-time highs we felt the need to dive deeper into the prevailing market structure to evaluate the state of the market. We believe the market displays one of the healthiest foundations only seen at previous market bottoms and see potential for tremendous price gains. Not without occasional volatility spikes and drawdown periods, but healthy and fast moving to the upside, nevertheless. Here is what we see:
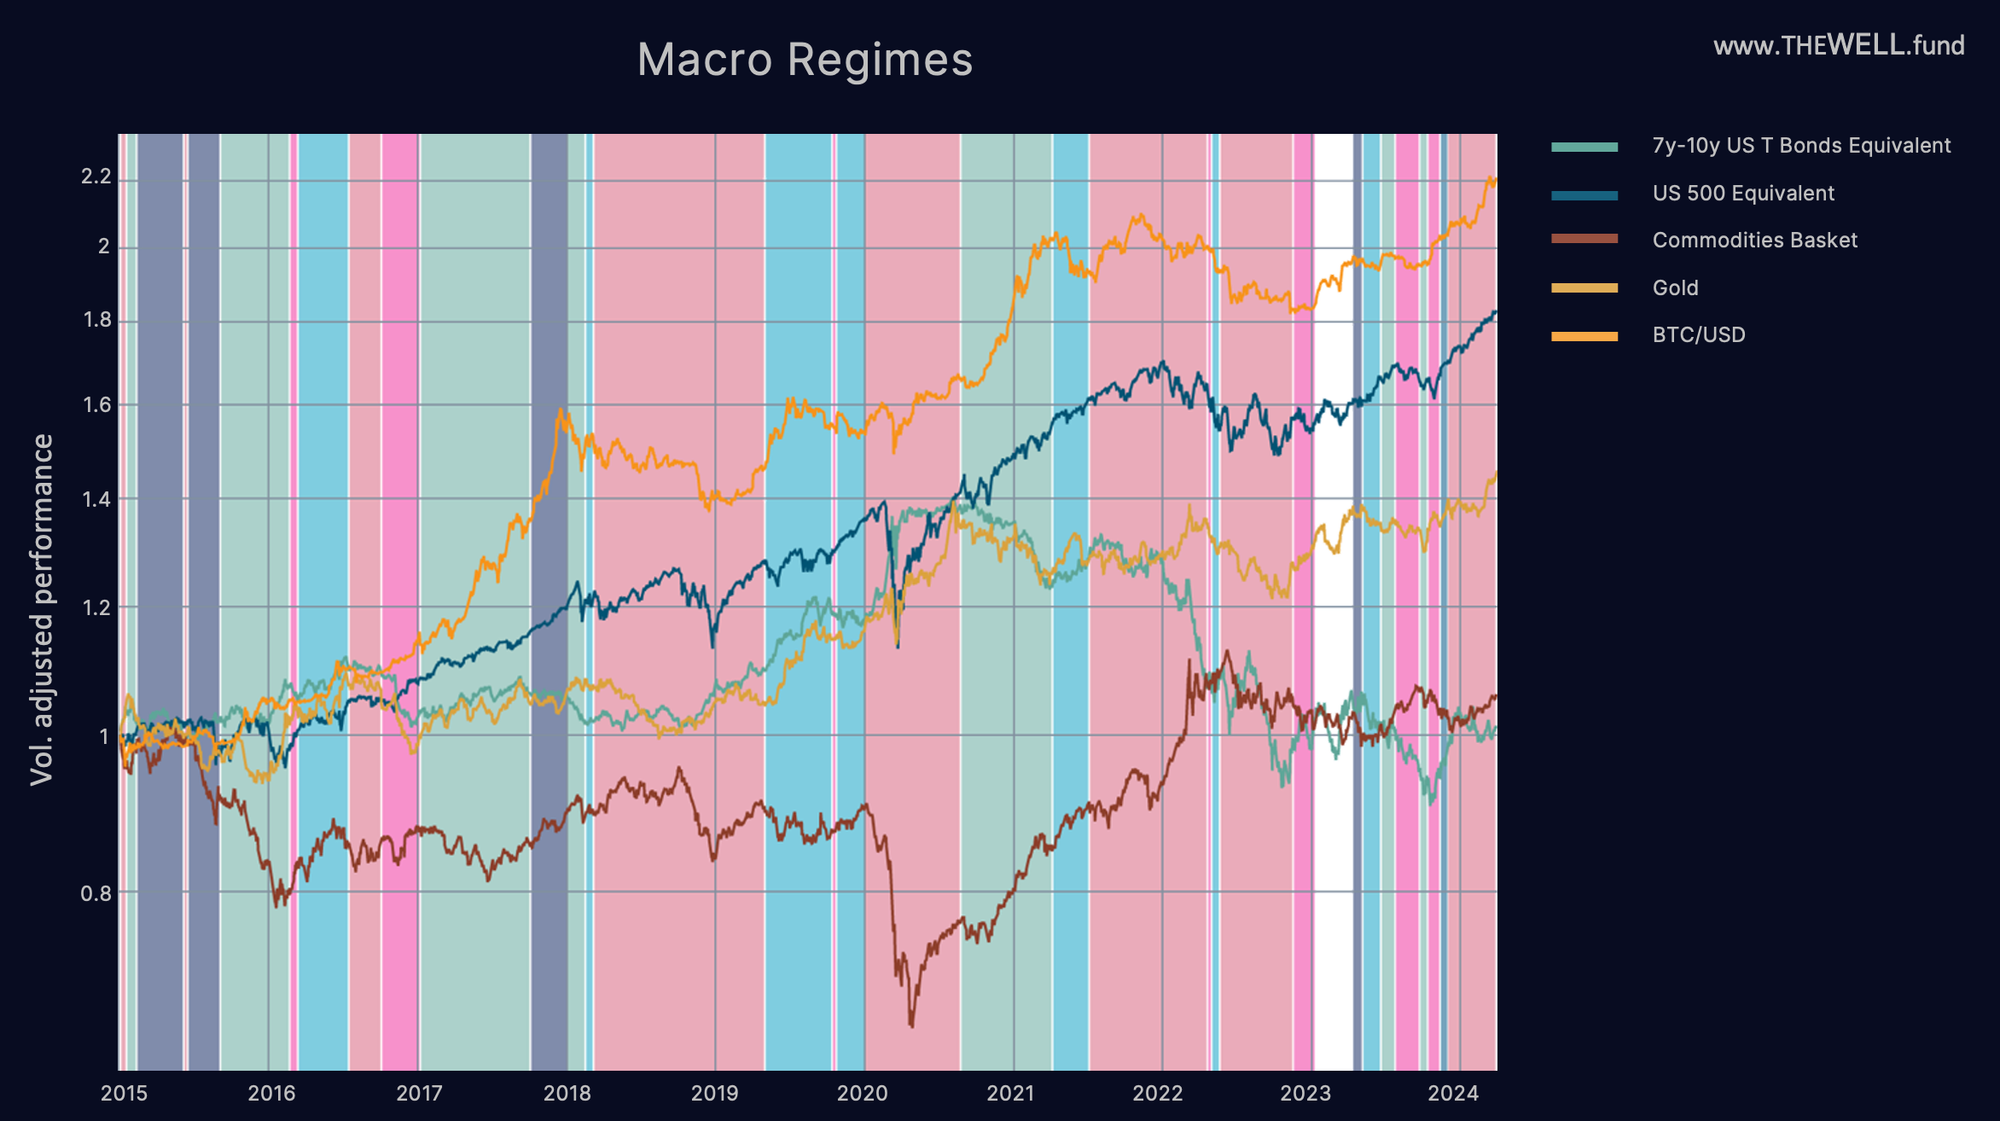
1) Market Regimes
Our market regime model that uses historical market data to evaluate market regimes, indicates an unfavorable regime for BTC since last November, with most other market regime having been more profitable for BTC holders than the current one (red). Despite this, BTC has made significant gains in that time frame. Most other regimes that can follow the current regime, have from a macro perspective, historically been even more favorable for BTC’s price development.

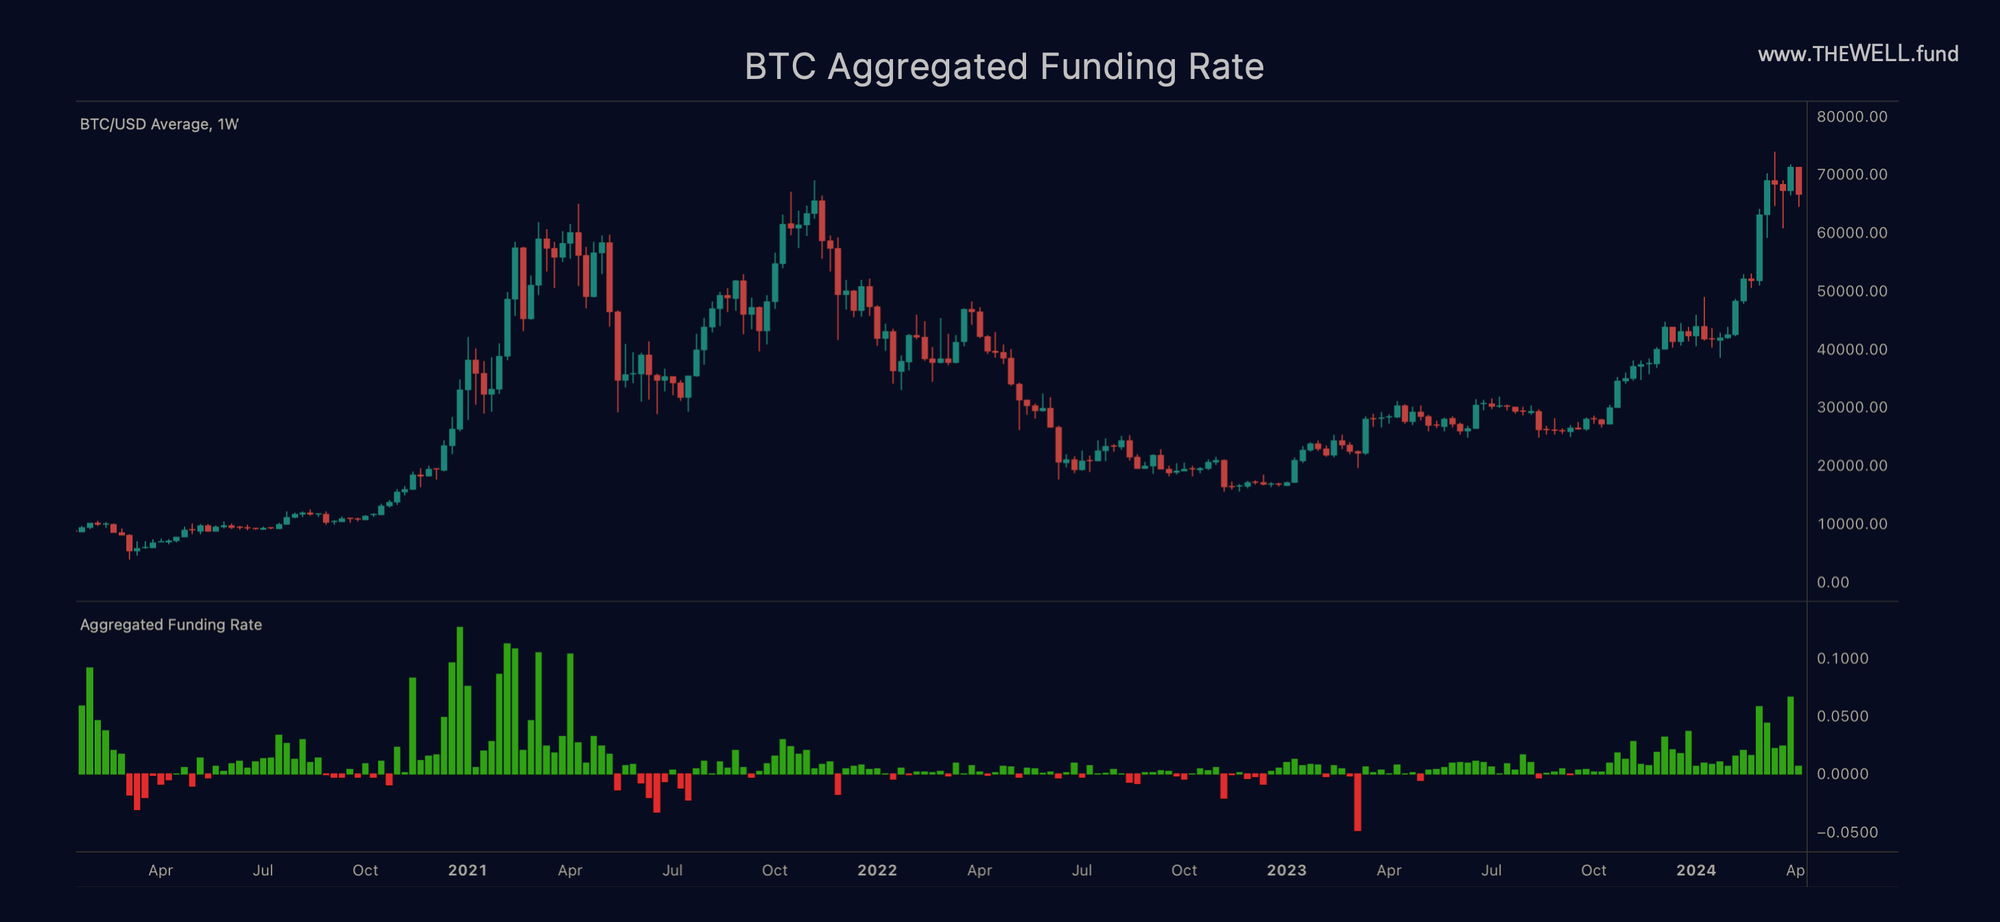
2) BTC Funding Rate
Funding rates, or the rate perpetual contract (i.e. futures) holders must pay for holding a BTC long position if the rate is positive (conversely, they get paid when it is negative) are a proxy for demand for leverage and exposure in the market. If the funding rate is very high, it suggests that market participants are highly levered and liquidation events can lead to substantial selloffs. The funding rate also provides an indication how active market participants are positioned. Consequently, very high rates suggest that traders are very long and expect strong moves to the upside.
An alternative interpretation is that physical BTC are rare and market participants must pay a higher price for exposure via derivatives (“perps”) to BTC.
Both interpretations tell us, that at current levels the market is nowhere near a market top. If anything, funding rates are slightly above the historical average but have a long way to go before they enter an overheated phase.

3) Liquidations
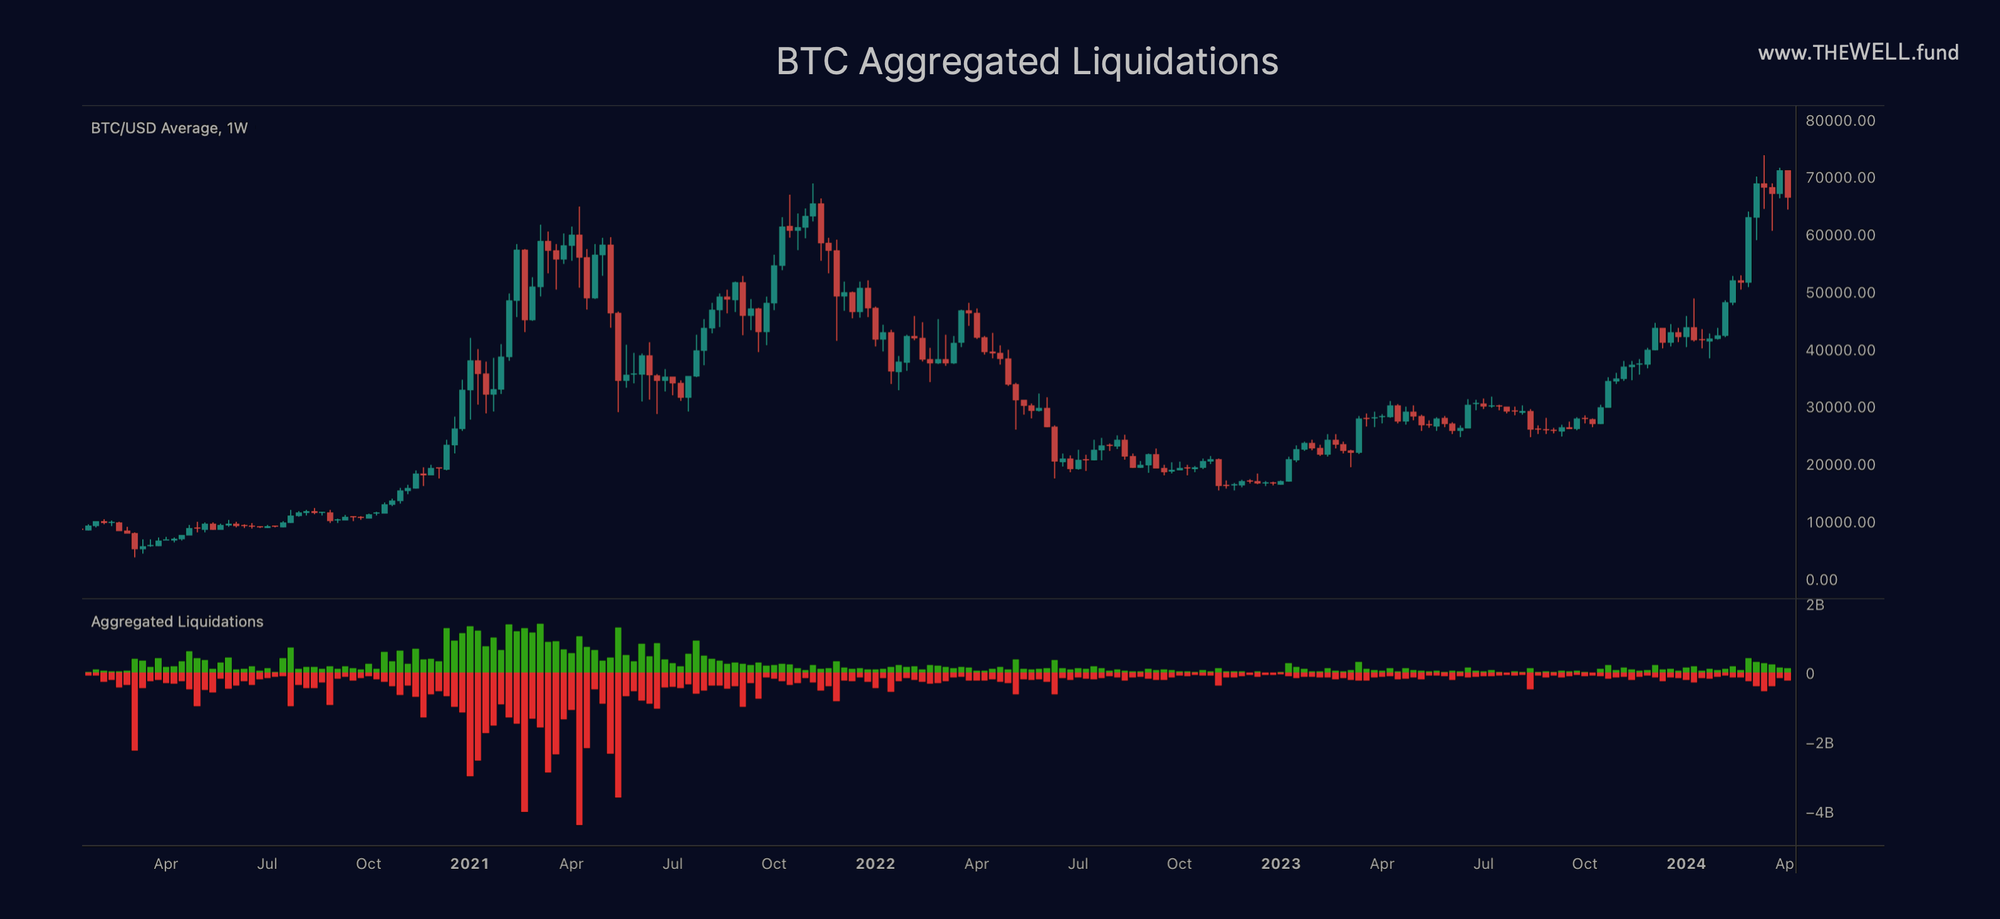
The number of forced sellers and buyers in the market can be measured. For instance, leveraged shorts get liquidated (i.e. receive a margin call if the price reaches the level at which the equity of their position becomes negative). They then become forced buyers (green/upward liquidation). It works the same way in the opposite direction for leveraged longs, if prices fall and they reach their liquidation price and they become forced sellers (red/downward liquidation). At specific price levels this can lead to so called “liquidation cascades”. In this scenario liquidations can reach extreme levels and many market participants get washed out of the market. Historically our models anticipate, handle and even profit from such scenarios.
What we can observe from the graph below, is that the current number of aggregated liquidations is close to the last bear market bottom, and we are nowhere near the levels seen at previous market tops. Even relatively uneventful phases like May to September 2020 had a multiple of the number of liquidations compared to what we currently see. This leads us to conclude, that we are far from a hyped-up, overleveraged market which would be more typical for a cycle top. Quite the opposite - it seems more akin to the beginning of a longer move.

In summary, we have no crystal ball, but with the halving on the horizon, the steady and strong ETF flows (especially ex-Grayscale, whose selling will likely slow down around the same time US financial advisors will start to recommend BTC ETFs at scale) and a healthy market structure, it looks like for us the most favorable cryptocurrency price moves are yet to come. This makes us very positive about the expected returns of the asset class and our momentum strategies.
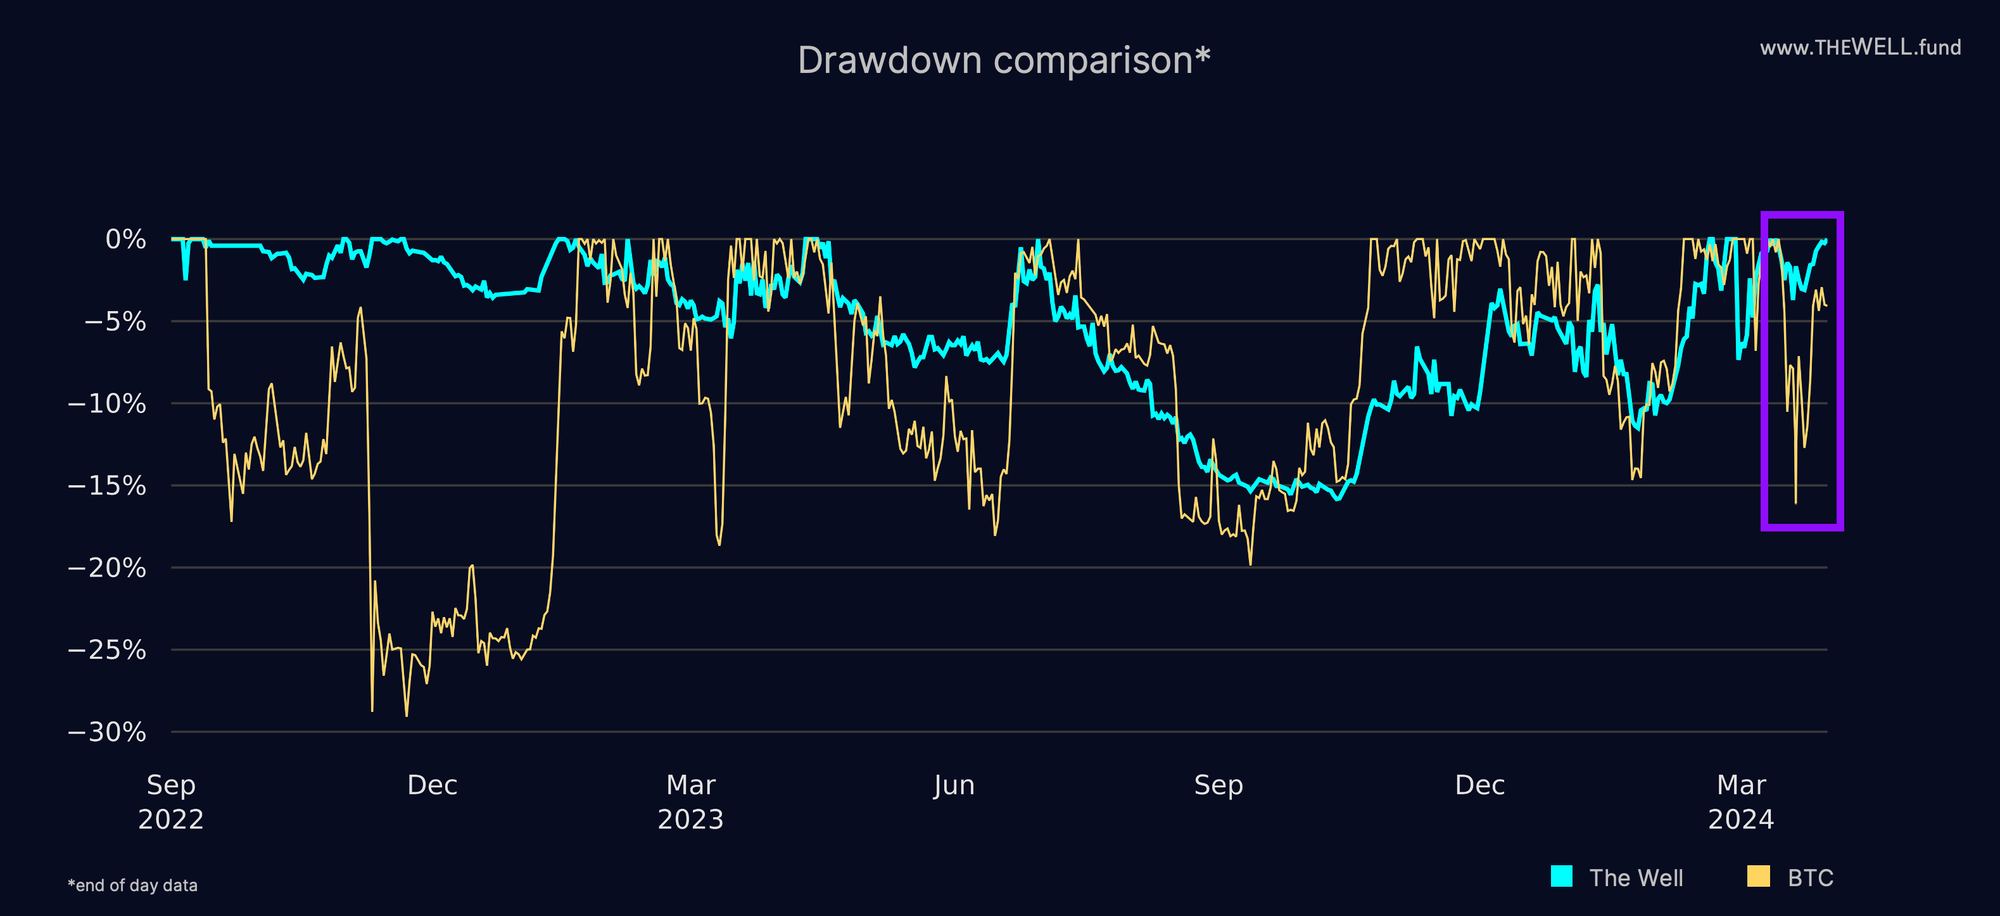
Despite already looking appealing, our drawdown profile was further improved by a new risk indicator in early March. This has paid off already, by reducing our exposure aggressively around the middle of the month, keeping our drawdown at less than -3.7% while BTC suffered a near -18% drawdown in March.

Whether you find yourself on the skeptical or optimistic side, if you wish to participate in the potentially very high expected returns of this asset class, allocating to a convexity capturing momentum fund is a solution that must be considered, if one has access to this sophisticated tool. Our strategies do the trend following for the investors, so our investors don’t have to time the market.
Positioning oneself ahead of returns is key in investing, ex ante, and this requires a little courage. Audentes fortuna Iuvat. However, as can be seen on our drawdown chart, an investor does not need to be that brave to invest in momentum strategies, even if the underlying asset class is highly volatile.
This blog post is shared with the intention to provide educational content, general market commentary or company specific announcements. It does not constitute an offer to sell or a solicitation of an offer to buy securities managed by The Well GP.
Any offer or solicitation may only be made pursuant to a confidential Private Placement Memorandum, which will only be provided to qualified offerees and should be carefully reviewed by any such offerees for a comprehensive set of terms and provisions, including important disclosures of conflicts and risk factors associated with an investment in the fund.
Past performance is not necessarily indicative of or a guarantee of future results.
The Well GP makes no representation or warranty, express or implied, with respect to the accuracy, reasonableness or completeness of any of the information contained herein, including, but not limited to, information obtained from third parties. The information contained herein is not intended to provide, and should not be relied upon for accounting, legal, tax advice or investment recommendations.
This publication may contain forward-looking statements that are within the meaning of Section 27A of the Securities Act of 1933, as amended (the “Securities Act”), and Section 21E of the Securities Exchange Act of 1934, as amended (the “Exchange Act”). These forward looking statements are based on the management’s beliefs, as well as assumptions made by, and information currently available to, management. When used in this presentation, the words “believe,” “anticipate,” “estimate,” “expect,” “intend” or future or conditional verbs, such as “will,” “should,” “could,” or “may,” and variations of such words or similar expressions are intended to identify forward-looking statements. Although the management believes that the expectations reflected in these forward-looking statements are reasonable, we can give no assurance that these expectations will prove to be correct.
