Momentum models – volatility and market timing
Dear LPs and friends of the fund,
given the overall challenging market environment, we would like to share some insights on how low volatility conditions affect the performance of momentum models and an evaluation on the near term future from a statistical perspective. We focus our analysis on BTC as it remains the main driver of market beta.
TL;DR
- Momentum returns depend on the absolute Sharpe ratio of an asset.
- BTC has historically displayed high absolute Sharpe ratios after periods of low volatility.
- Therefore, we see it as exceedingly likely that momentum strategies are well positioned to profit from a return to the historical norm.
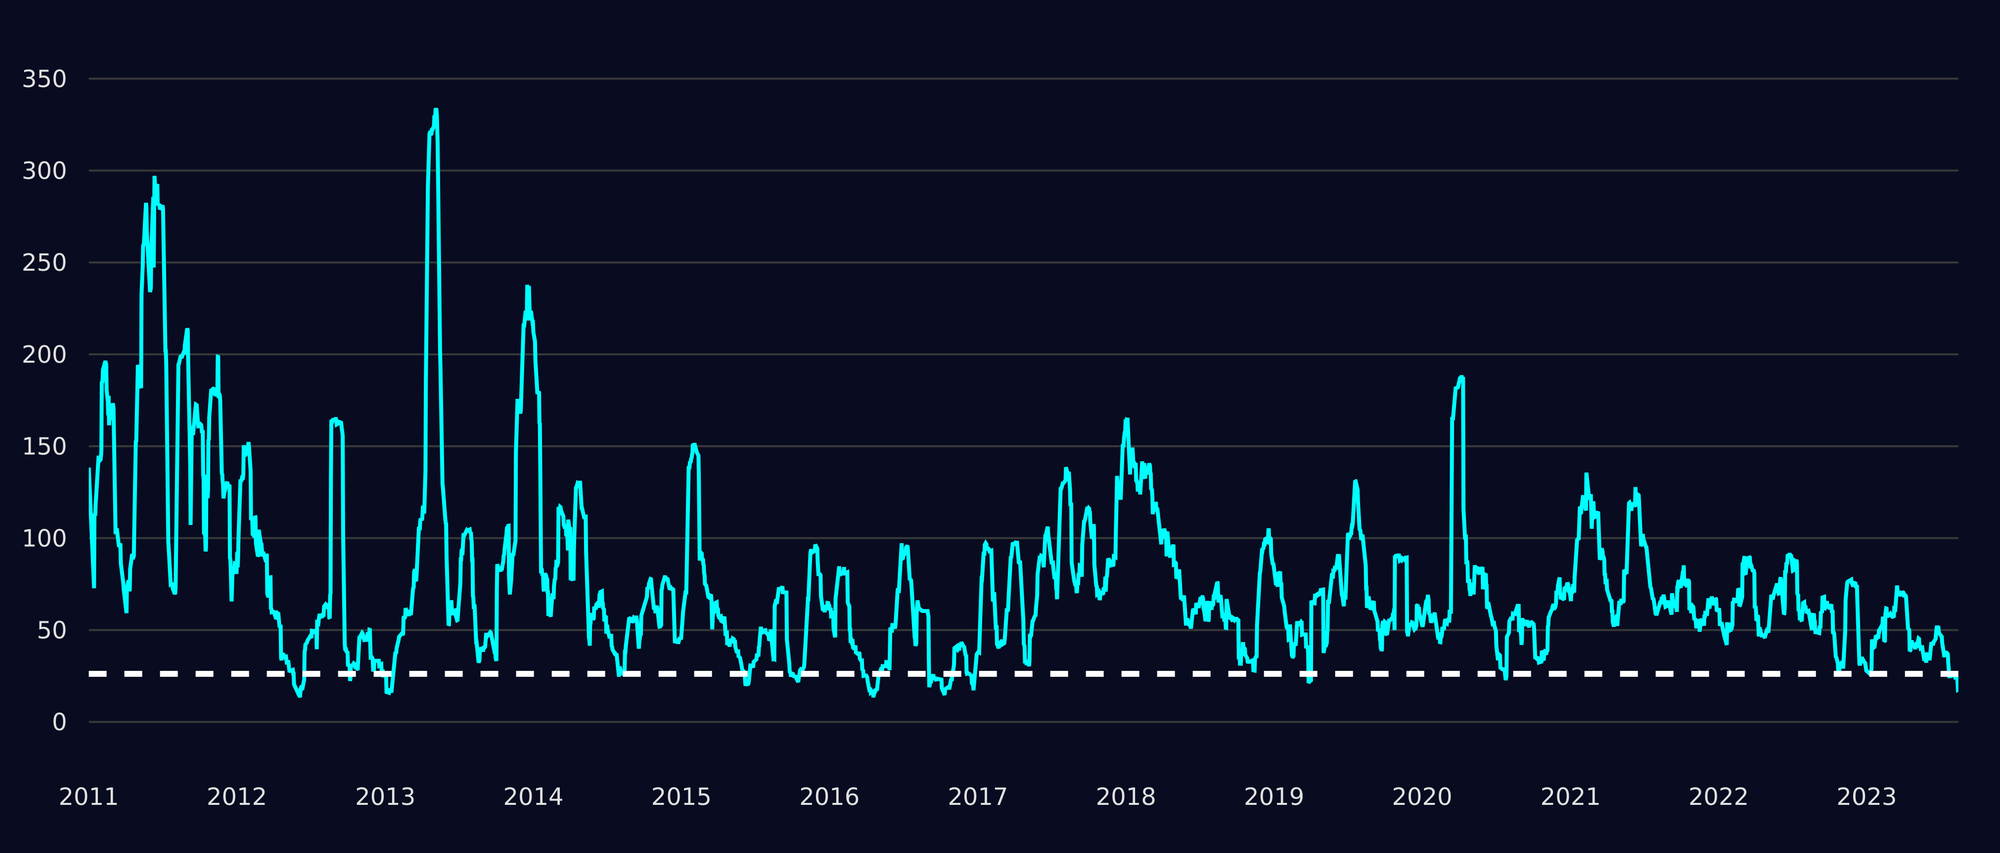
BTC’s realized volatility has been exceptionally low in the last year, so low in fact, that the long-term average is already trading almost 50% lower compared to the median volatility (<40% annualized current vol vs 69% median vol):

From a statistical perspective, low volatility phases in the market lead up to an inflection point that precedes volatility ultimately returning to the market, as observed in 2016 and 2020. Additionally, as peers in other asset classes have published, volatility cannot be compressed over long periods of time, only transferred across time. Hence, a new regime in the markets is to be expected.

When one compares the monthly absolute returns of BTC to its volatility, one can see, that phases of low volatility (which we are in right now) often precede larger and even very large outsized BTC returns. Momentum strategies are specifically engineered to benefit from high volatility and performance is dependent on high absolute Sharpe ratios of the underlying assets. For a more mathematical explanation please see this paper.

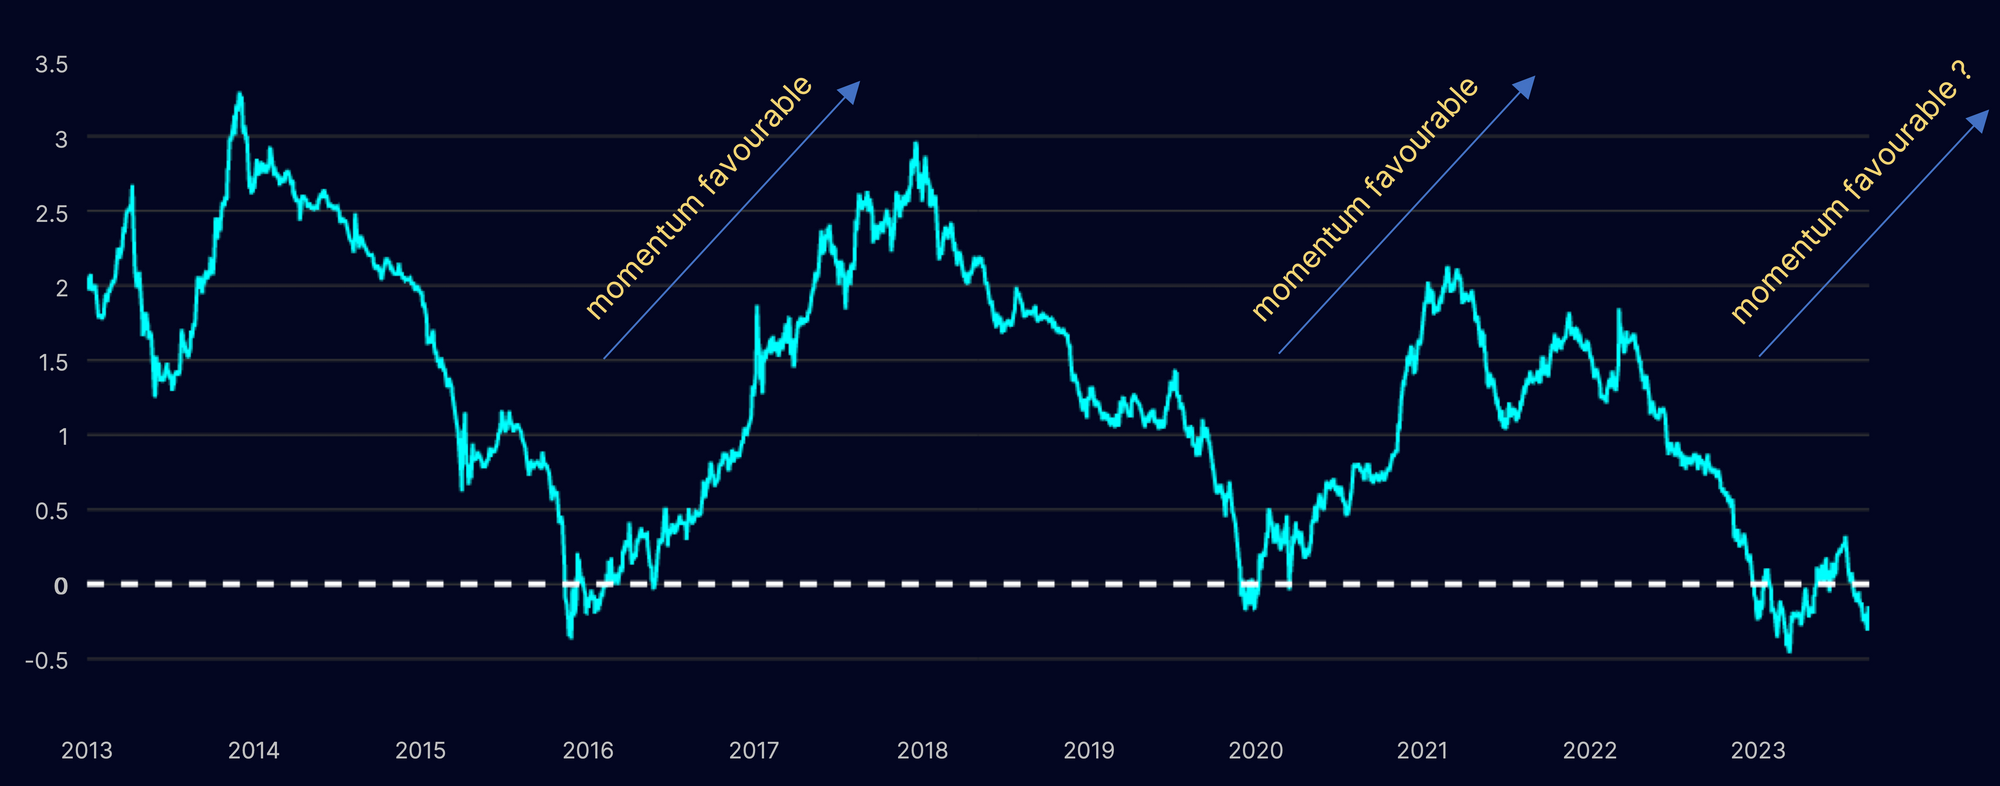
Current BTC absolute Sharpe ratio hovers at a historically low level. Assets tend to have stable long term Sharpe ratios (e.g., for US equities the Sharpe is consistently around 0.3 over different measures of time). Similarly, BTC’s Sharpe ratio since 2010 has been around 1.47 annualized (assuming a risk-free rate (rf) of 0%). BTC’s rolling Sharpe ratio, with a lookback window of 2 years, is well below that level. Hence, a return to the mean does seem likely in the near future.
The current phase in the market suggests with a high degree of probability that we are well positioned for a return of volatility and with it the potential for excess returns to be captured by momentum strategies. If two centuries of evidence is any guide, one may be excited by those levels of historical deviations from the norm.
A Century of Evidence on Trend-Following Investing - AQR
Two Centuries of Multi-Asset Momentum - Geczy, Damonov
Your team at The Well
This blog post is shared with the intention to provide educational content, general market commentary or company specific announcements. It does not constitute an offer to sell or a solicitation of an offer to buy securities managed by The Well GP.
Any offer or solicitation may only be made pursuant to a confidential Private Placement Memorandum, which will only be provided to qualified offerees and should be carefully reviewed by any such offerees for a comprehensive set of terms and provisions, including important disclosures of conflicts and risk factors associated with an investment in the fund.
Past performance is not necessarily indicative of or a guarantee of future results. The Well GP makes no representation or warranty, express or implied, with respect to the accuracy, reasonableness or completeness of any of the information contained herein, including, but not limited to, information obtained from third parties. The information contained herein is not intended to provide, and should not be relied upon for accounting, legal, tax advice or investment recommendations.

