Regime change signs detected
Dear LPs and friends of the fund,
Please note, we don’t see ourselves in the business of making market predictions or investment recommendations. However, historical price data, which we use to build our models, contains a considerable amount of valuable information, especially when analyzing data across asset classes and time intervals. This gives us insight into the probabilities for potential future pathways, which may be interesting from a portfolio optimization perspective.
In our recent blog post, we have analyzed the historically low levels of volatility and absolute Sharpe ratio that currently characterize the crypto market landscape. If history is any guide, one can expect these metrics to go back up to average after the recent down phase. We now observe the initial signs, that potentially indicate a broader shift in the markets is ahead.
TL;DR
Currently financial markets are alternating between two regimes: "early trend & neutral state" and "mid trend & trend rebuilding". The latter regime was historically caused by monetary debasement (i.e. ‘money printing’). In a "mid trend & trend rebuilding" regime, Bitcoin would likely shine again. (This is independent of bullish factors like the Q1 'halving' or possibly likely Bitcoin spot ETF approvals in Q1)
As we have shared previously, we include data from traditional markets such as stocks, bonds, commodities and FX when testing our models. In addition, we also look at predictive statistical models that analyze the markets in the context of the overall macro environment. This research focuses on sentiment analysis and cross-sectional behavior of gold, equities, bonds and commodities to produce an informed evaluation of the likely regime the market is currently in and the most probable path forward for each asset class, during a given regime. Based on the path predictions during a regime phase, one can see what the market is pricing for e.g. rates and inflation.
We define five general market regimes in the cross sectional returns of asset classes. They can appear in any sequential order:
· Strong trends & elevated volatility
· Trend changes, bottoming patterns & calm before the storm
· Trend changes, topping patterns & intermediate calmness
· Mid trend & trend rebuilding
· Early trend & neutral states
Our models indicate that we currently oscillate between the “early trend & neutral states” and “mid trend & trend rebuilding state”:
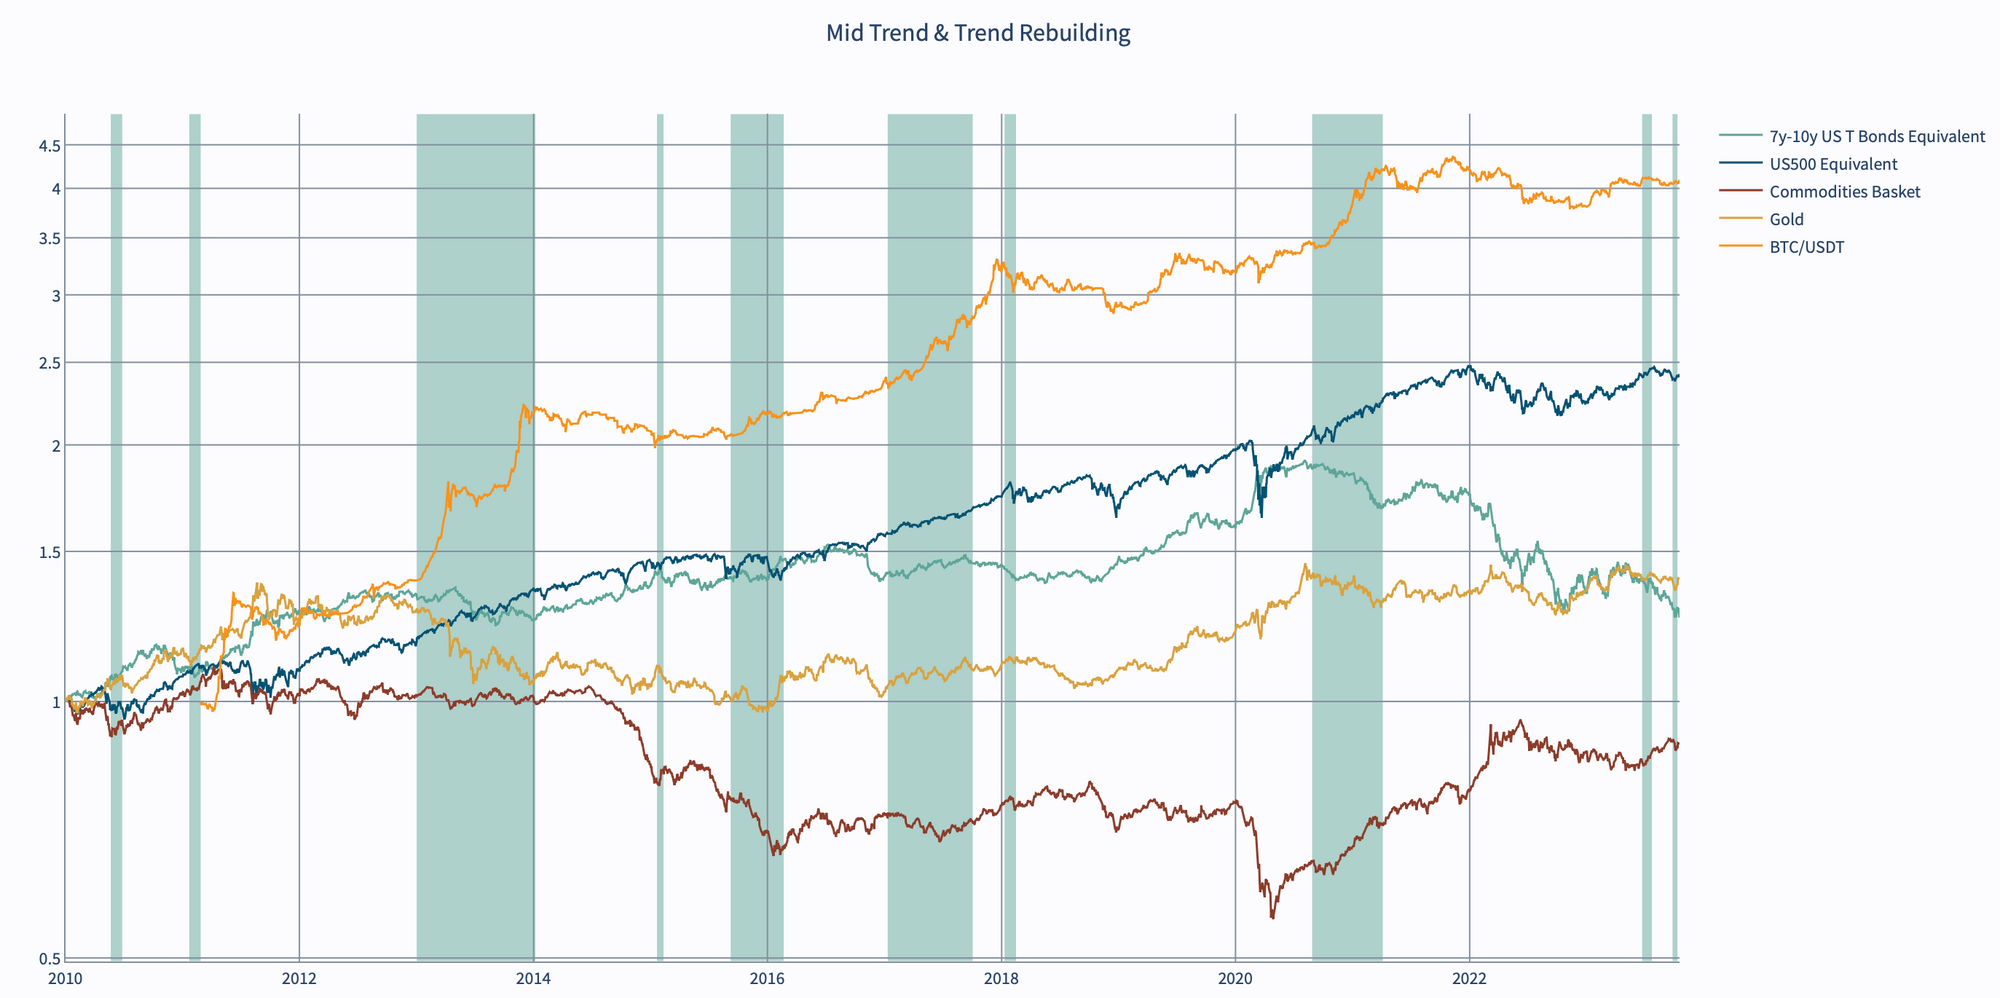
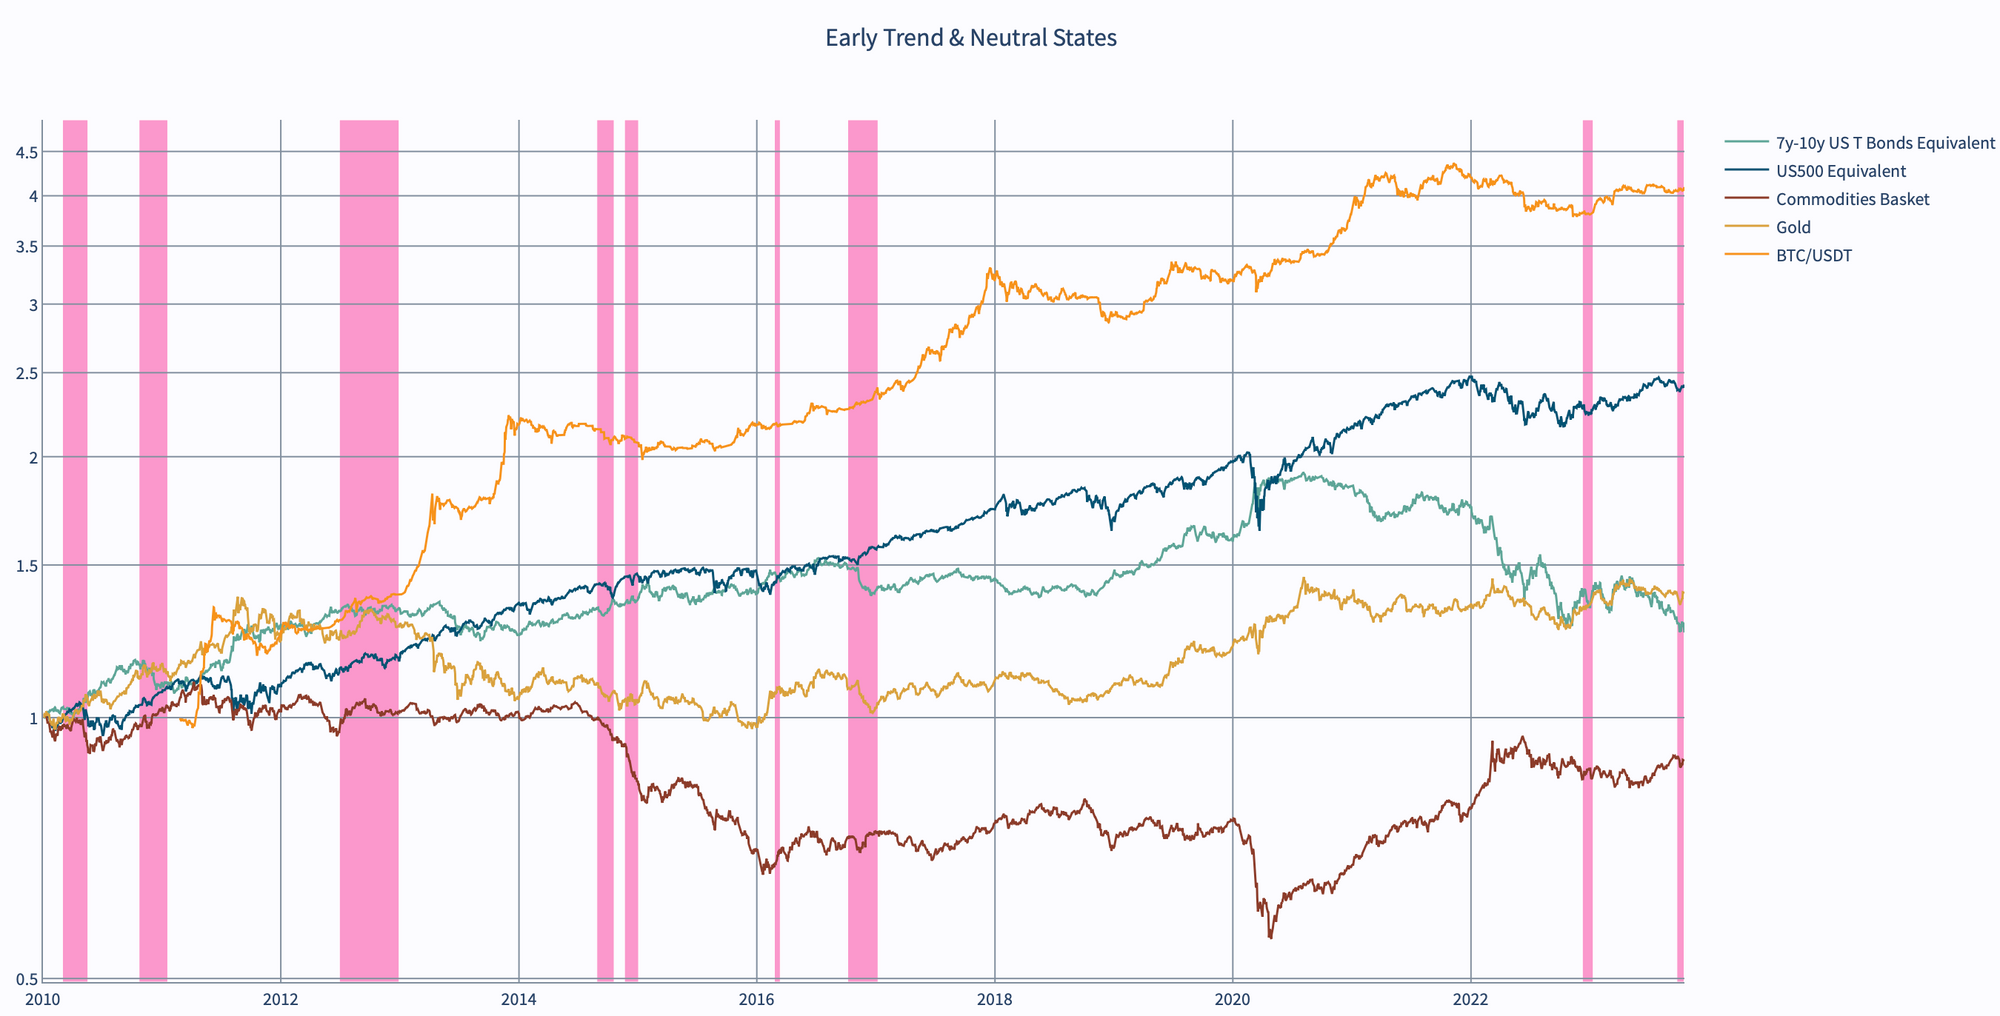
The above graphs illustrate the performance of bonds, S&P500 stocks, commodities, gold and BTC since 2010. The plots are log scaled and the assets are scaled to equal volatility for better comparison. Each green area indicates a “mid trend & trend rebuilding” regime, while the pink areas indicate the “early trend & neutral states” regime.
Based on pattern recognition and historical regime data, it is expected, that the median duration of the current predicted paths for these asset classes is roughly between 50 and 160 days. “Mid trend & trend rebuilding” does look very favorable for BTC, while historically, “early trend & neutral states” have been rather challenging for BTC.
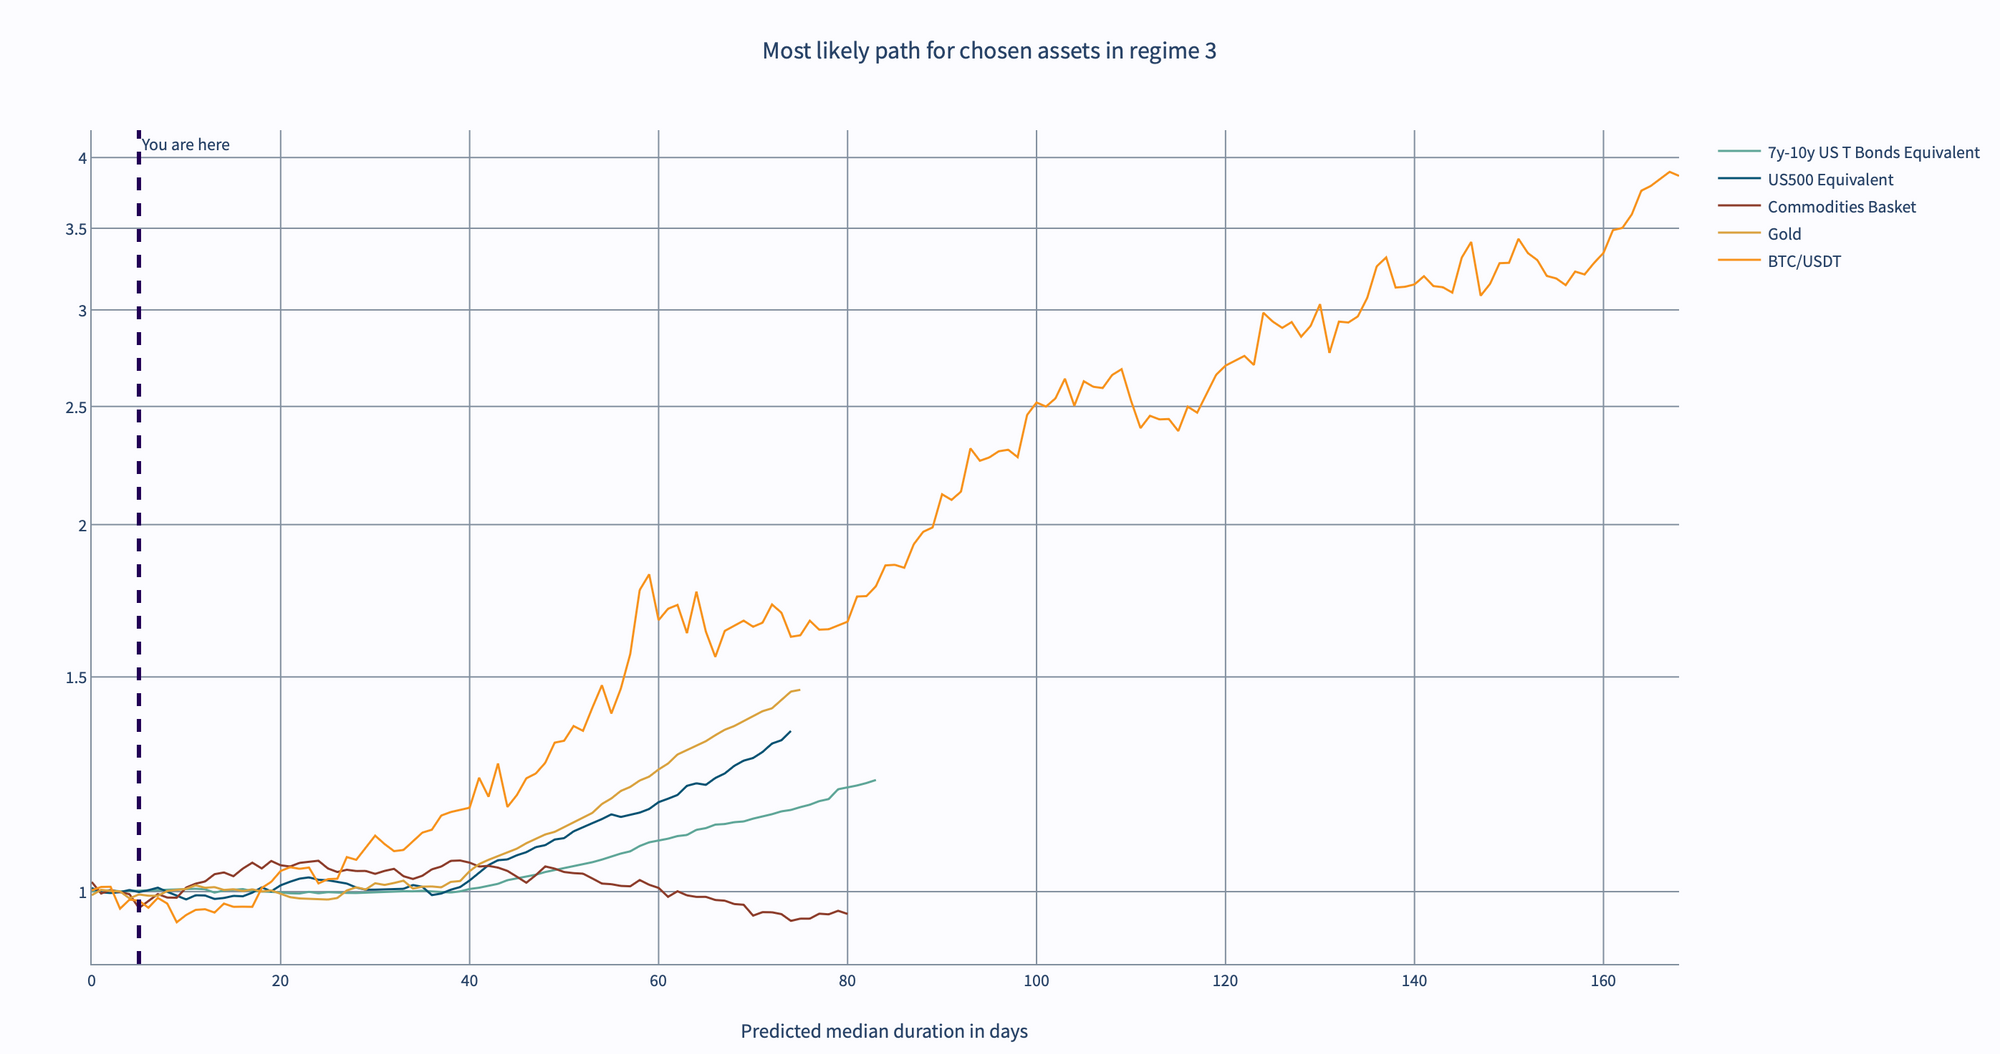
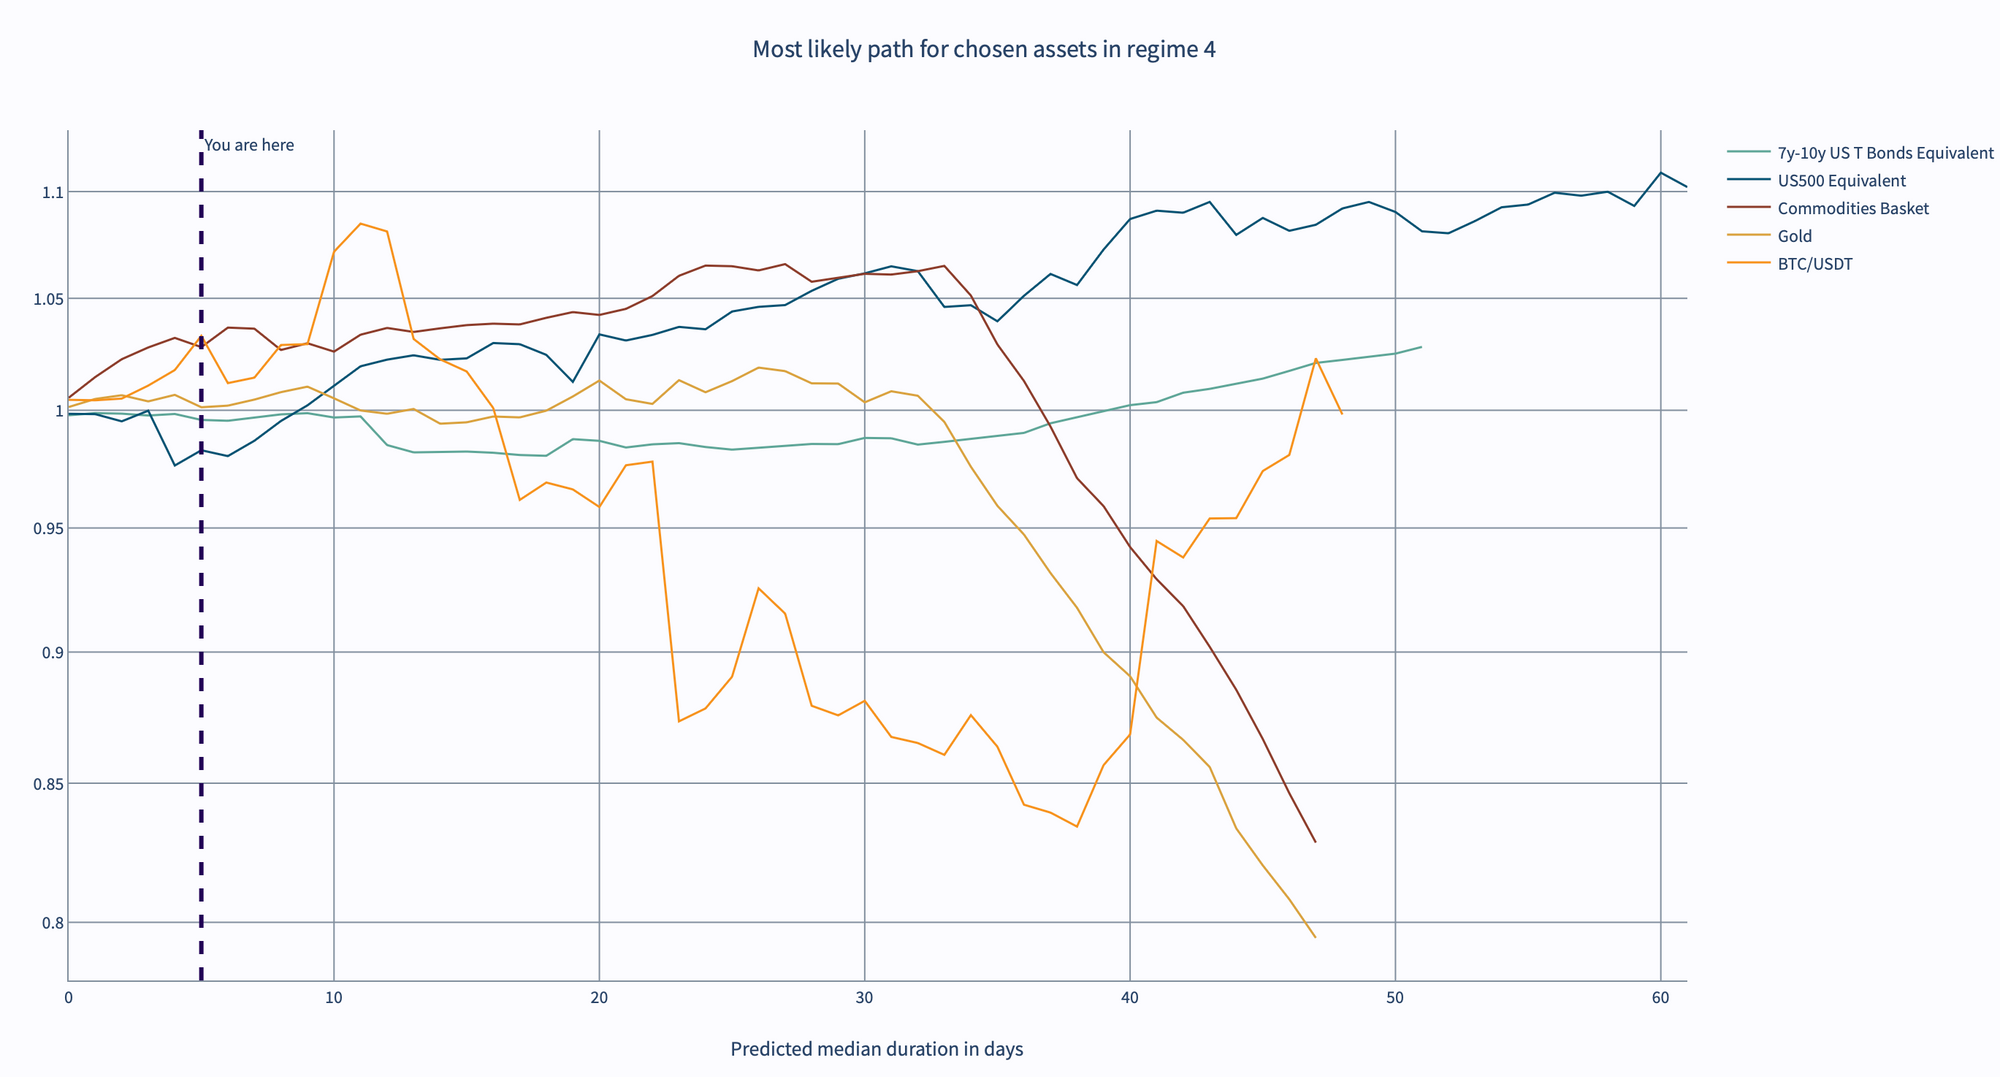
The graphs represent the median return of an asset based on the highest correlation to all existing historical market phases. Each asset can have a different path duration based on the expected behavior. A y-axis value of 3.5 would mean a return of 350%. This is not a prediction, rather a directional interpolation of historical returns for the expected duration.
According to the model, BTC is expected to outperform all other asset classes, if the regime manifests to become mid trend & trend rebuilding. Interestingly it has the longest median duration prediction compared to other asset classes.
It is important to note, that with more days into a regime, the path predictions get more accurate as they are constantly updated to match the most likely historical patterns.
No model is perfect, and regimes can change within days. Nonetheless, given the available historical data, we believe this to be an informed insight.
Real-world events that indicate a possible regime change:
1) The FED stopped raising rates.
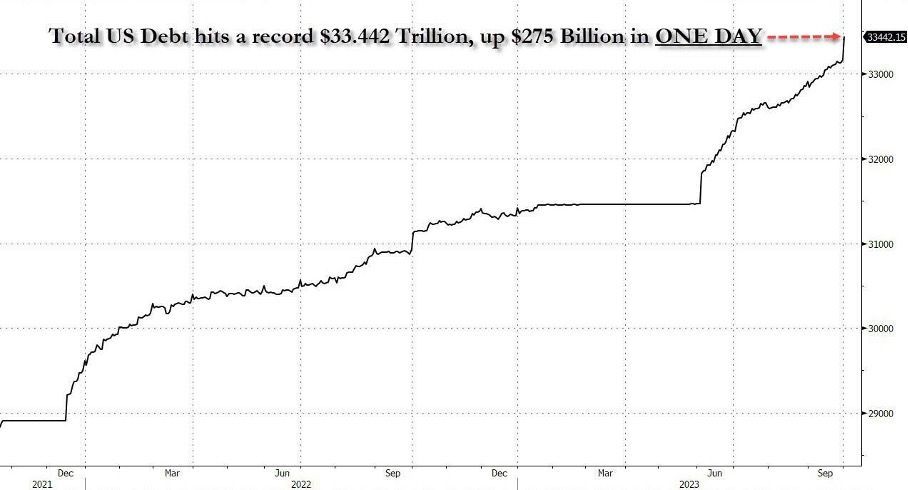
2) Total US debt rose by $275 billion in one day - a new record.
3) CDS (Credit Default Swaps) of large banks are increasing (=heightened default risk), which could lead to monetary inflation to avoid the banks going bust.
4) China "printing" already – ECB & FED to follow?
5) Potential upcoming wars would require even more monetary debasement to counter the new debt taken on by governments.
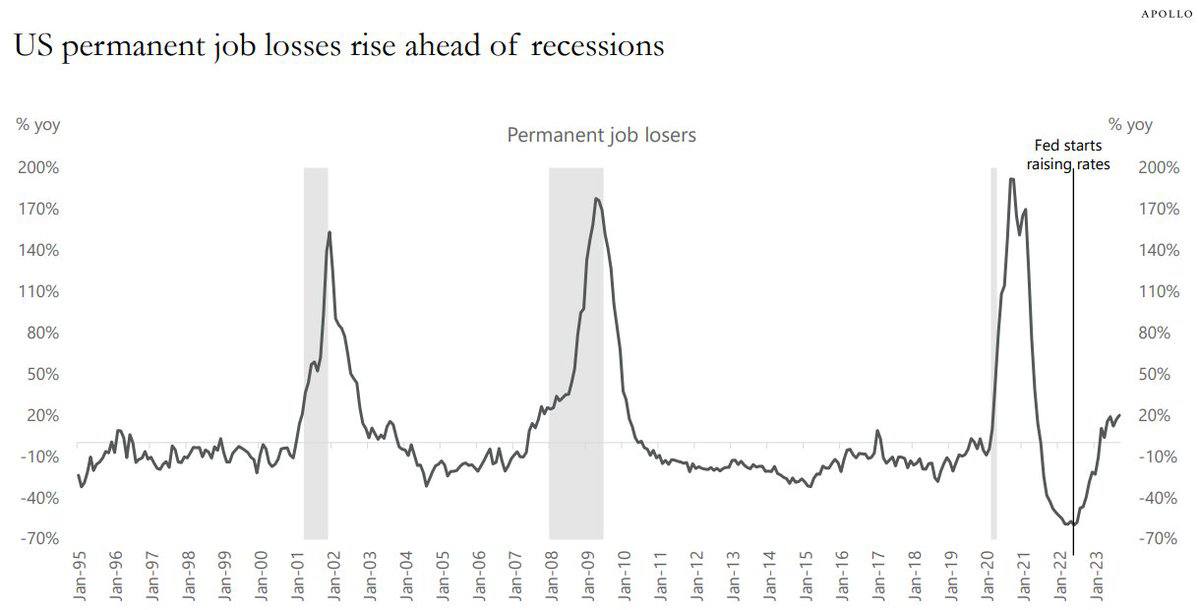
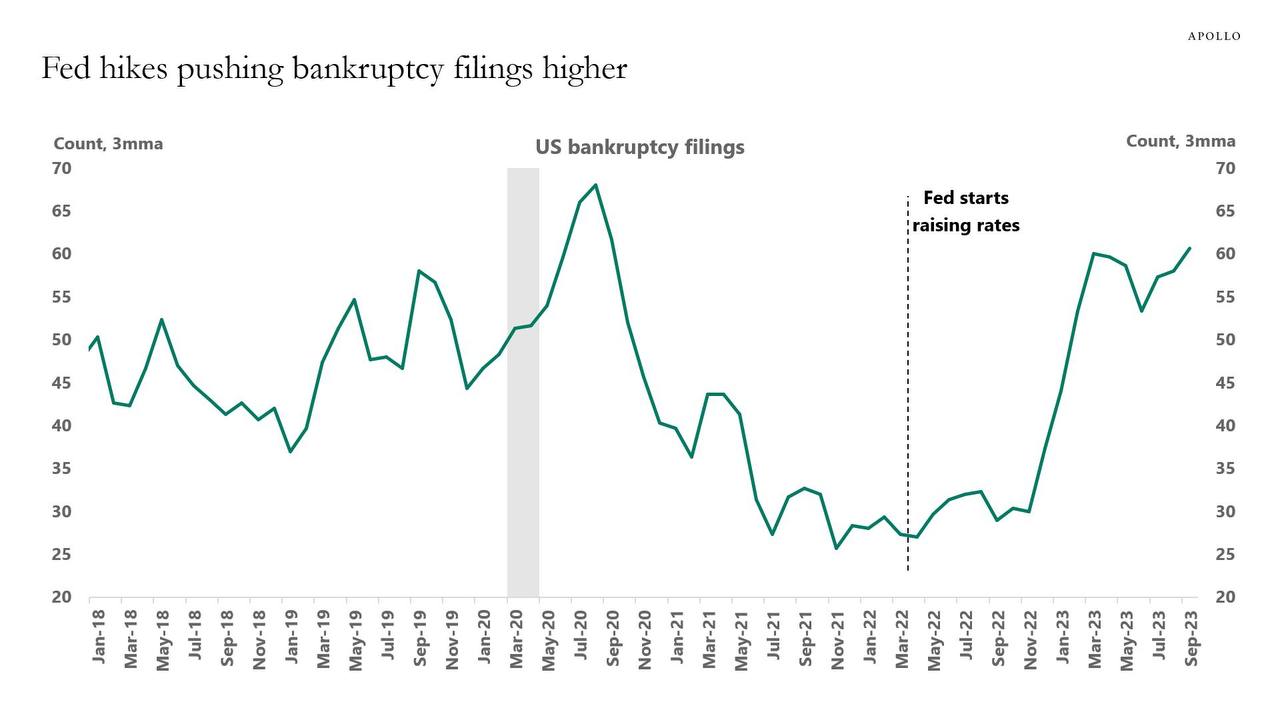
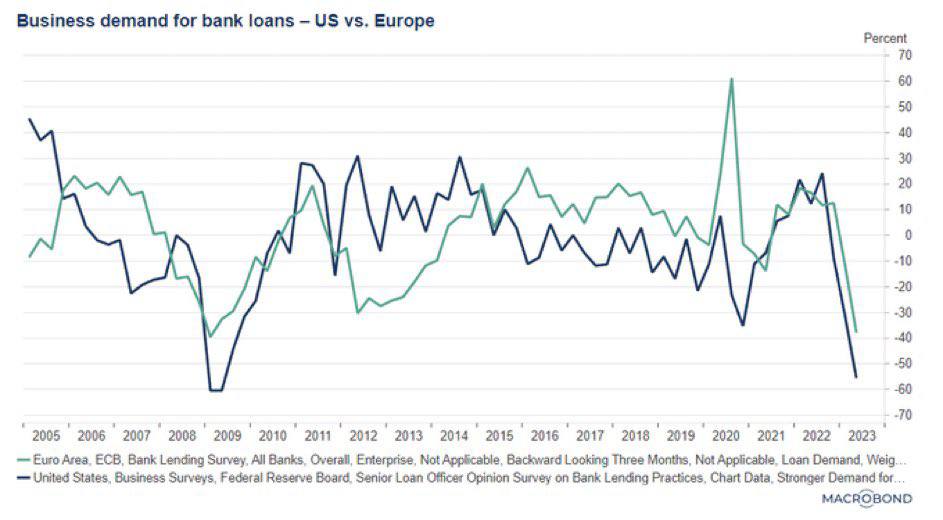
Are the US and Europe facing recessions soon? If yes, it could be assumed that the money spigots will be opened again:
6) US job losses on the rise:
7) Bankruptcy filings increasing:
8) Demand for bank loans is falling:
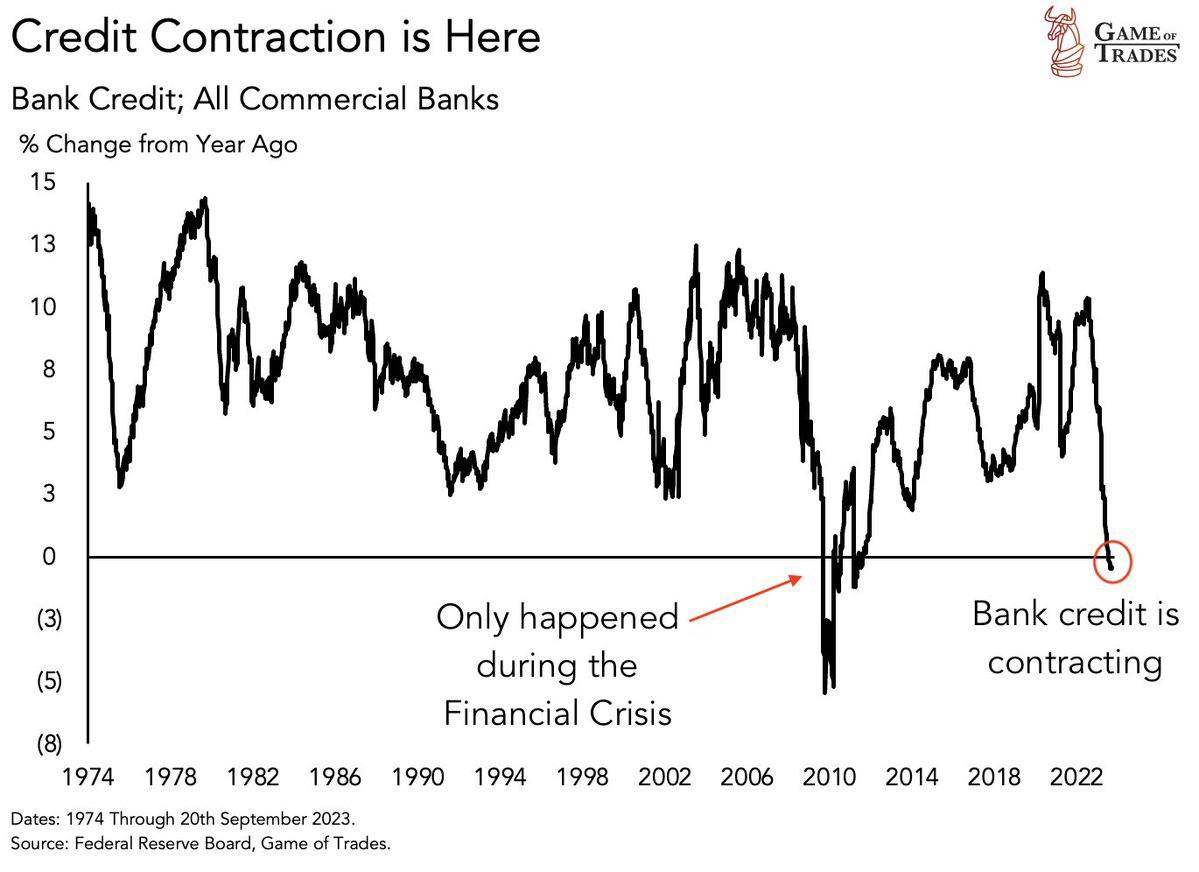
9) Credit is contracting. It is worth noting here, that all money in existence, but cash and coins is credit.
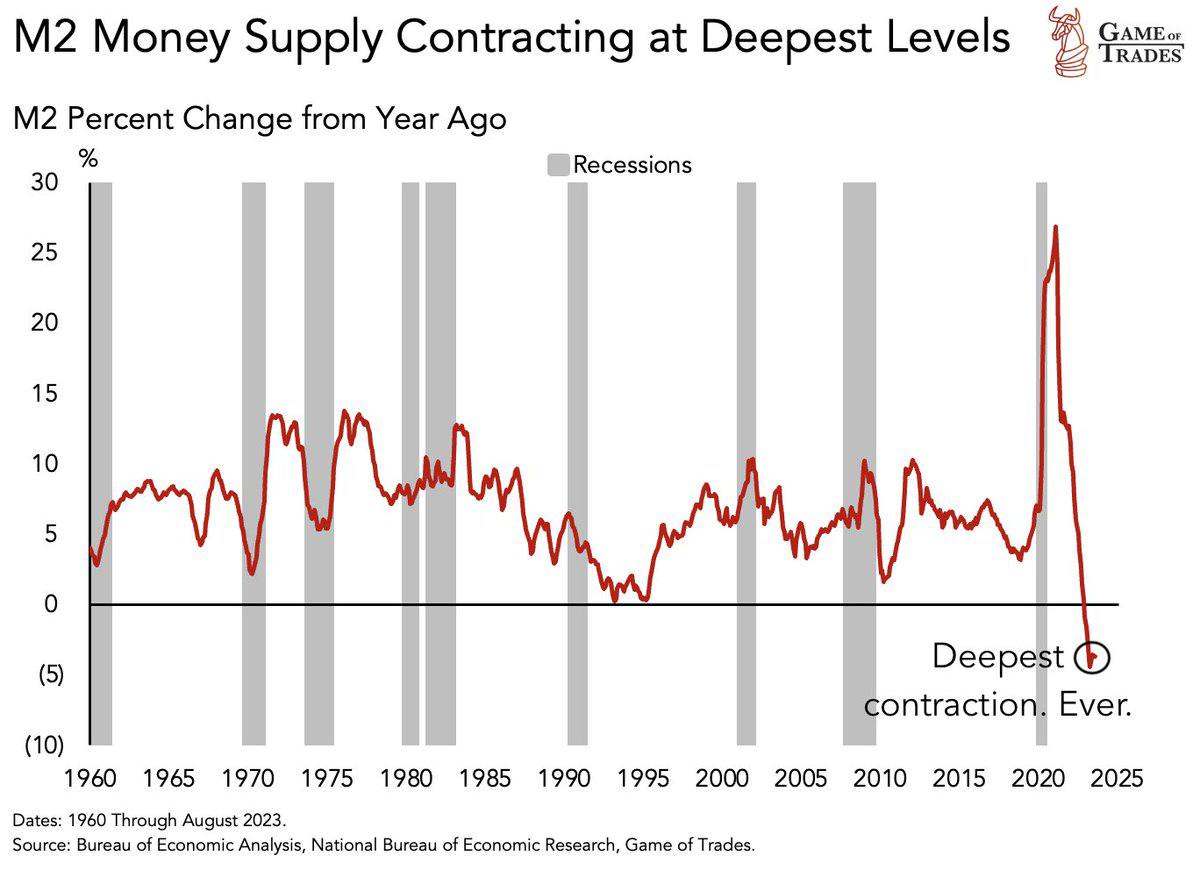
10) M2 money supply is contracting as fast as ever!
Once the regime associated with "money printing" establishes itself, which assets would you like to hold and what are the best risk mitigated ways of doing that?
Your team at The Well
This blog post is shared with the intention to provide educational content, general market commentary or company specific announcements. It does not constitute an offer to sell or a solicitation of an offer to buy securities managed by The Well GP.
Any offer or solicitation may only be made pursuant to a confidential Private Placement Memorandum, which will only be provided to qualified offerees and should be carefully reviewed by any such offerees for a comprehensive set of terms and provisions, including important disclosures of conflicts and risk factors associated with an investment in the fund.
Past performance is not necessarily indicative of or a guarantee of future results.
The Well GP makes no representation or warranty, express or implied, with respect to the accuracy, reasonableness or completeness of any of the information contained herein, including, but not limited to, information obtained from third parties. The information contained herein is not intended to provide, and should not be relied upon for accounting, legal, tax advice or investment recommendations.
This publication may contain forward-looking statements that are within the meaning of Section 27A of the Securities Act of 1933, as amended (the “Securities Act”), and Section 21E of the Securities Exchange Act of 1934, as amended (the “Exchange Act”). These forward looking statements are based on the management’s beliefs, as well as assumptions made by, and information currently available to, management. When used in this presentation, the words “believe,” “anticipate,” “estimate,” “expect,” “intend” or future or conditional verbs, such as “will,” “should,” “could,” or “may,” and variations of such words or similar expressions are intended to identify forward-looking statements. Although the management believes that the expectations reflected in these forward-looking statements are reasonable, we can give no assurance that these expectations will prove to be correct.
